Background
These are calculations I have done based on data in Dati Statistici Vol. I 2a Edizione USMMM Roma 1972. The figures very clearly show the extent of the autumn supply crisis, which almost cut off supplies to North Africa at the very moment the fighting reached the highest pitch of intensity of all year, and how much the situation improved prior to Operation Venezia in May 1942.

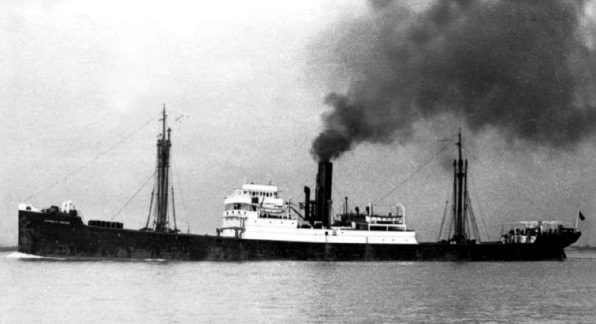
SS Oriani, sunk by No. 105 Squadron R.A.F. on 13 September 1941, while travelling from Patrassos to Benghazi on a supply run. Unknown origin.
Data
Arrival rates of all military[1]supplies in NA, Italian navy data, all units, volume of military supplies received in 1,000 tons (for the two key months the information on military supplies sent is added):
Jul 41 – 81% (61.5kt)
Aug 41 – 87% (75.6kt)
Sep 41 – 79% (66.3kt)
Oct 41 – 76% (56.2kt)
Nov 41 – 26% (16.2kt/61.9kt)
Dec 41 – 78% (29.7kt/38.2kt)
Jan 42 – 100% (60.5kt)[2]
Feb 42 – 100% (56.8kt)
Mar 42 – 80% (38.7kt)
Apr 42 – 99% (142.0kt)
May 42 – 92% (76.6kt)
Jun 42 – 79% (30.1kt)
Jul 42 – 92% (74.4kt)
Aug 42 – 66% (49.0kt)
Sep 42 – 81% (77.3kt)
Oct 42 – 50% (33.9kt)
Nov 42 – 74% (60.3kt)
Notes
[1]The quite considerable deliveries for civilian needs are excluded from the calculations. For example, in November 41, 13,604 tonnes of 17,310 sent arrived in North Africa. In December, all 9,441 tonnes sent arrived.
[2]Note that this is not fully correct – about 200 tons of January supplies were lost at least on submarine Saint Bon (sunk 5 January by HMS Upholder) and liner Vittoria, sunk by combined air/sub torpedo attack on 23 January.
[2]Note that this is not fully correct – about 200 tons of January supplies were lost at least on submarine Saint Bon (sunk 5 January by HMS Upholder) and liner Vittoria, sunk by combined air/sub torpedo attack on 23 January.
Note that ‘non-arrived’ does not necessarily mean sunk, since it could also include convoys that departed but had to turn back (e.g. Convoy “C” on 24 November 41).
Detailed Tables for download
These tables were created by user Paspartoo for this thread on the Axis History Forum. Please let me know if they read okay once opened in a separate window.


